Connecting The Dots Part 3
In this series, we will examine and connect the dots, on several topics, all of which are contributing to stagflation, low interest rates, negative economic growth, and the greatest asset bubbles of all time.
In order, we have examined Secular Stagnation, Quantitative Easing, Free Float Capitalization and The $1 Trillion Penalty for Saving. Lets look at a few of the factors involved like Money.
M1 = cash and checking in circulation
M2 = M1 + savings
MZM = M2 + money market
M3 = M2 + large deposits + institutional
M3 was discontinued in 2006, MZM and MB are preferred.
MB = St Louis Adjusted Monetary Base = M1;currency in circulation outside Federal Reserve Banks and the Treasury + deposits of domestic depository institutions at Federal Reserve Banks; and float-pricing related as-of adjustments.
MZM, M1 in billions since 1975
Notice MZM growth vs M1 growth since 1975 when the ratio was 2.25 to 1; March 2000 4 to 1; today it is 4.55 to 1. Why? more currency, more savings.
MZM Velocity Ratio since 1959

Current velocity of MZM is at the lowest level that it has been since the beginning of 1959. Why? The ratio of savings (inactive money) far outweighs the cash in play.
M1, M2, MZM Velocity Ratio

Note the low and declining velocity levels of M2 & MZM as opposed to M1 cash in play. Why? M2 is weighed down by dormant savings; MZM is weighed down by both dormant savings and money market accounts.
M1, M2, MZM, MB in billions since 1981

Notice how MB tracks M1 and MZM tracks M2. Why? They are similar in composition. Notice M1's comparatively small growth as opposed to the other aggregates. Although MZM and M2 are dormant stocks, look at the amount they have grown. Why? All the money parked in low interest assets. Note how MB went flying by M1 in 2008. Why? Next 2 charts.
M1, M2, MZM, MB index tied to 12/2007

See how MB leaps off the line in 2008. Why? Next chart.
M1, M2, MZM, MB annual % change since 2008
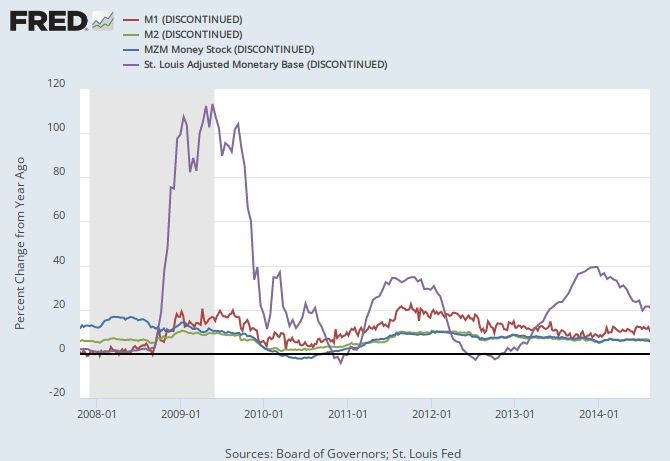
As opposed to the other three aggregates, notice the massive distortions in MB since 2008. Why? Through SOMA, system open market account holding the Fed's ledger ballooned from $850 billion to over $4 trillion.
Bare this in mind, when rates go down, money velocity goes down, when rates go up, velocity goes up. We will come back to this later.
More to come in Part 4.
In order, we have examined Secular Stagnation, Quantitative Easing, Free Float Capitalization and The $1 Trillion Penalty for Saving. Lets look at a few of the factors involved like Money.
M1 = cash and checking in circulation
M2 = M1 + savings
MZM = M2 + money market
M3 = M2 + large deposits + institutional
M3 was discontinued in 2006, MZM and MB are preferred.
MB = St Louis Adjusted Monetary Base = M1;currency in circulation outside Federal Reserve Banks and the Treasury + deposits of domestic depository institutions at Federal Reserve Banks; and float-pricing related as-of adjustments.
MZM, M1 in billions since 1975
Notice MZM growth vs M1 growth since 1975 when the ratio was 2.25 to 1; March 2000 4 to 1; today it is 4.55 to 1. Why? more currency, more savings.
MZM Velocity Ratio since 1959
Current velocity of MZM is at the lowest level that it has been since the beginning of 1959. Why? The ratio of savings (inactive money) far outweighs the cash in play.
M1, M2, MZM Velocity Ratio
Note the low and declining velocity levels of M2 & MZM as opposed to M1 cash in play. Why? M2 is weighed down by dormant savings; MZM is weighed down by both dormant savings and money market accounts.
M1, M2, MZM, MB in billions since 1981
Notice how MB tracks M1 and MZM tracks M2. Why? They are similar in composition. Notice M1's comparatively small growth as opposed to the other aggregates. Although MZM and M2 are dormant stocks, look at the amount they have grown. Why? All the money parked in low interest assets. Note how MB went flying by M1 in 2008. Why? Next 2 charts.
M1, M2, MZM, MB index tied to 12/2007
See how MB leaps off the line in 2008. Why? Next chart.
M1, M2, MZM, MB annual % change since 2008
As opposed to the other three aggregates, notice the massive distortions in MB since 2008. Why? Through SOMA, system open market account holding the Fed's ledger ballooned from $850 billion to over $4 trillion.
Bare this in mind, when rates go down, money velocity goes down, when rates go up, velocity goes up. We will come back to this later.
More to come in Part 4.
Comments